23
2016
Using RenderDoc with Unity (graphics debugger)
 An article by
“”
Getting Started
– Download standalone https://renderdoc.org/builds
– Install it
– Start Unity 5.3 or later (I tested with 5.4beta.f2)
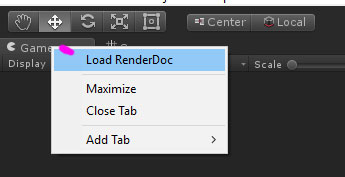
– Right click over the Game- or Scenewindow title, RenderDoc option should be displayed in the menu, Select it
– New icon appears next to “Maximize on Play” or “Gizmos”
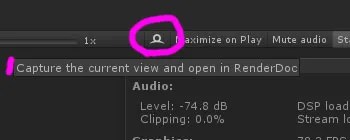
– Click that icon to capture next frame into RenderDoc (takes a while to start)
– RenderDoc opens, double click the thumbnail in “Captures collected list” to select capture
– All kind of random data & magical numbers are displayed 🙂
Resources
RenderDoc Tutorials : https://www.youtube.com/watch?v=kkySSu2MPKQ
RenderDoc Docs : https://renderdoc.org/docs/index.html
Unity Docs : https://docs.unity3d.com/Manual/RenderDocIntegration.html
RenderDoc sources
https://github.com/baldurk/renderdoc
—
Other tools
– Intel Graphics Performance Analyzer : https://software.intel.com/en-us/gpa
– AMD GPU Shader Analyzer : http://developer.amd.com/tools-and-sdks/graphics-development/gpu-shaderanalyzer/


Related Posts


20 Comments + Add Comment
Leave a comment
Recent posts
- Editor Tool: Property Watcher
- .unityignore : Hide files from Project window
- PostBuild Script to Create Single exe Standalone File
- Game Loop Designer
- Favorites in PackageManager
- LudumDare59 : Signal
- Unity Editor: Tree Generator
- Leaf/Foliage Generator Tools (Runs in Browser)
- Testing Unity AI Beta
- Ways to Support UnityCoder Development
- Using UI Slider to Create 5-Star Rating Element
- Game Music Library For Unity (editor plugin)
Connect


Recent Comments
Coin:
CUgDSbRqFcAumDSAcdKDvuXsw26VdkJe8C8WGUQHBAGS
Wow! Thanks a lot, very interesting!
Short but very straighforward, i know about RenderDoc but didn’t about that Unity detect RenderDoc installed, Thx for the info 😀
GAPID is a collection of tools that allows you to inspect, tweak and replay calls from an application to a graphics driver. GAPID can trace any Android debuggable application:
https://github.com/google/gapid
Project that can be used to learn Graphics Performance Analyzer toolkit by following along Unity* Optimization Guide for Intel x86 Platforms article
https://github.com/GameTechDev/UnityPerformanceSandbox
Mali Graphics Debugger
https://developer.arm.com/products/software-development-tools/graphics-development-tools/mali-graphics-debugger
NVIDIA PerfHUD: real-time performance analysis tool for Direct3D applications
https://developer.nvidia.com/nvidia-perfhud
Intel Performance Profiler
https://software.intel.com/en-us/intel-vtune-amplifier-xe
Snapdragon Profiler
https://developer.qualcomm.com/software/snapdragon-profiler
Adreno profiler for Android (can live edit shaders on device, also can edit shader in Unity, compile it, copy paste to device!)
https://developer.qualcomm.com/software/adreno-gpu-profiler
gearvr / oculus performance tools
https://developer.oculus.com/documentation/unity/latest/concepts/unity-perf/#unity-perf-hud
Event Tracing for Windows (ETW)
https://msdn.microsoft.com/en-us/library/windows/desktop/aa363668(v=vs.85).aspx
GPUView
https://graphics.stanford.edu/~mdfisher/GPUView.html
Windows Performance Analyzer (WPA)
https://docs.microsoft.com/en-us/windows-hardware/test/wpt/windows-performance-analyzer
Android SysTrace
https://developer.android.com/studio/profile/systrace.html
android profiling tools
https://unity3d.com/learn/tutorials/topics/best-practices/android-profiling-tools
debugging with visual studio
https://docs.unity3d.com/Manual/SL-DebuggingD3D11ShadersWithVS.html
using renderdoc (Oculus Connect 5 | Reinforcing Mobile Performance with RenderDoc)
using nsight for stutter analysis
https://forum.unity.com/threads/performance-overview.735185/#post-5213711
GPU architecture resources
https://interplayoflight.wordpress.com/2020/05/09/gpu-architecture-resources/
3rd party profilers for general performance
(visual studio, superluminal, UIForETW, vtune, very sleepy, …)
profiler (paid)
https://superluminal.eu/
using PIX profiler
profiling unity with SuperLuminal
https://discussions.unity.com/t/profiling-in-unity-using-superluminal/1614358